【MapLibre GL JS】地図タイルを白から黒までのグレースケール(モノクロ)で表示する
本記事について
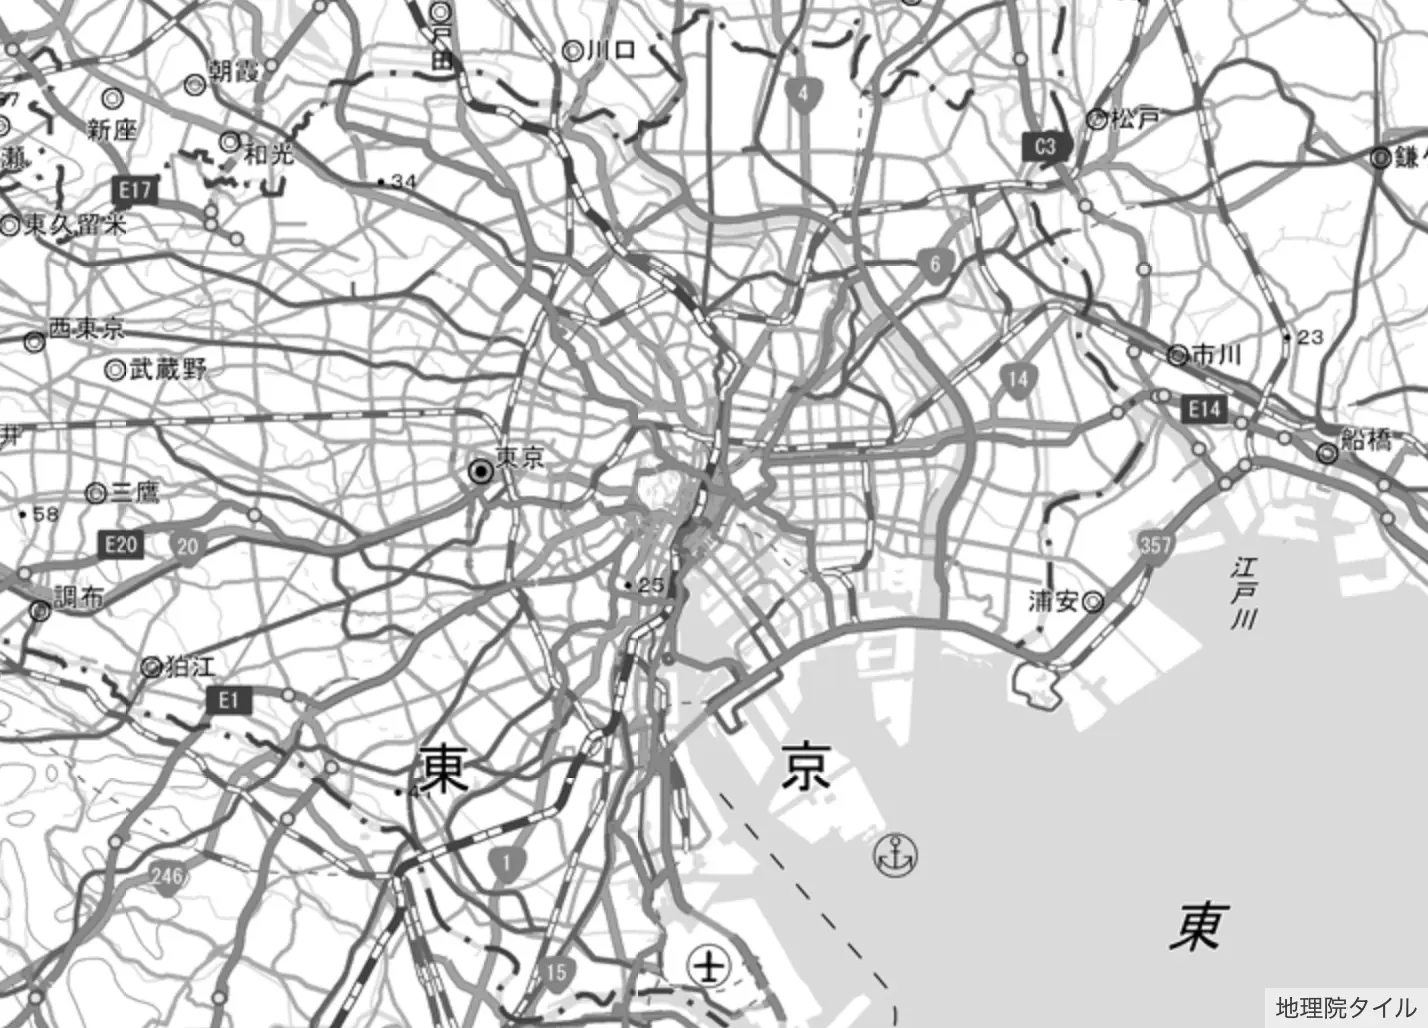
MapLibre GL JSを使って、地理院タイルの標準地図をグレースケールで表示する方法を紹介する。
地理院タイルの標準地図をグレースケールで表示する
lasterレイヤーのraster-saturationプロパティを-1にすれば良い。
raster-saturationプロパティは、-1~1の範囲で指定することができ、-1だと彩度が0、すなわちグレースケールになる。
raster-saturationプロパティの詳細は、以下のリンクを参照。
サンプルコード
<!DOCTYPE html>
<html lang="ja">
 <head>
  <meta charset="utf-8" />
  <meta name="viewport" content="width=device-width, initial-scale=1" />
  <title>サンプルコード</title>
  <link href="https://unpkg.com/maplibre-gl/dist/maplibre-gl.css" rel="stylesheet" />
  <style>
   body {
    margin: 0;
    padding: 0;
   }
   #map {
    position: absolute;
    top: 0;
    bottom: 0;
    width: 100%;
   }
  </style>
 </head>
 <body>
  <div id="map"></div>
  <script src="https://unpkg.com/maplibre-gl@2.4.0/dist/maplibre-gl.js"></script>
  <script>
   const map = new maplibregl.Map({
    container: "map",
    style: {
     version: 8,
     sources: {
      "raster-tiles": {
       type: "raster",
       tiles: ["https://cyberjapandata.gsi.go.jp/xyz/std/{z}/{x}/{y}.png"],
       tileSize: 256,
       attribution:
        "<a href='https://maps.gsi.go.jp/development/ichiran.html' target='_blank'>地理院タイル</a>",
      },
     },
     layers: [
      {
       id: "raster-layer",
       type: "raster",
       source: "raster-tiles",
       paint: {
        "raster-saturation": -1,  // 彩度を0にする
       },
      },
     ],
    },
    center: [139.77, 35.68],
    zoom: 10,
   });
  </script>
 </body>
</html>
出力結果